Visual Changelog - May 2021#
Display the Difference Between Model Runs as a Percent#
Fig. 17 Now, when normalizing to another model run, you can choose to display the differences as a percentage rather than as the raw values.#
Settings Work Now + A New Setting To Increase Table Density#
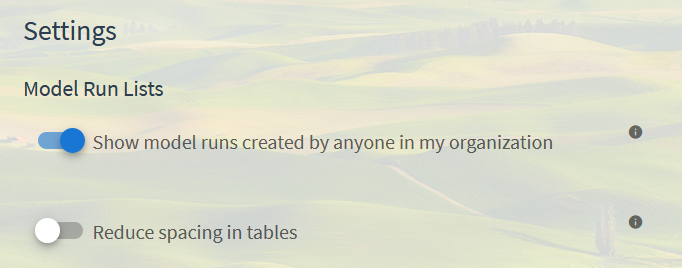
Fig. 18 We’ve had a settings section for a while, but it had a bug where you couldn’t actually change anything. That’s been fixed and you can now make use of the previously existing setting to change whether the list of model runs shows all model runs in your organization by default, or just yours. Additionally, we added a new setting that allows for denser table displays by removing some of the padding in each table cell.#
Better Communication of Disabled Region Adjustments#
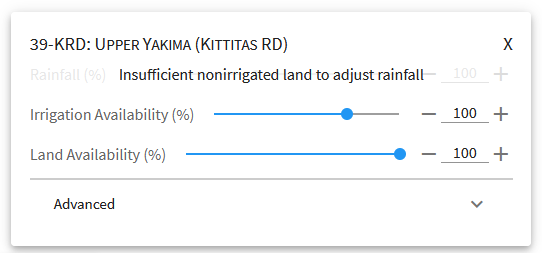
Fig. 19 Previously, when a model area supported an adjustment, such as rainfall or irrigation, but the region didn’t support it, the slider would disappear from that region’s card, creating confusion. Now the card disables the slider and displays text overlaying the slider explaining why the slider is disabled.#
Removal of Regions with Disabled Sliders from Map#
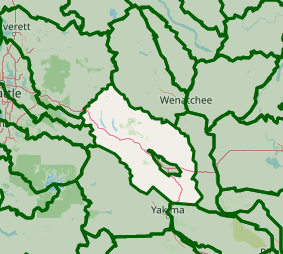
Fig. 20 When we disable a slider (such as for rainfall in the above example), the region will also be removed from the map on the page when viewing the cumulative input modifications. It does not currently remove a region that doesn’t support rainfall or irrigation until it has a card created for modifications. That is, if a region doesn’t support rainfall, it’ll still show on the map with the all crops changes until a card is added for the region.#
New Chart Options: Set Title and Model Run Name#
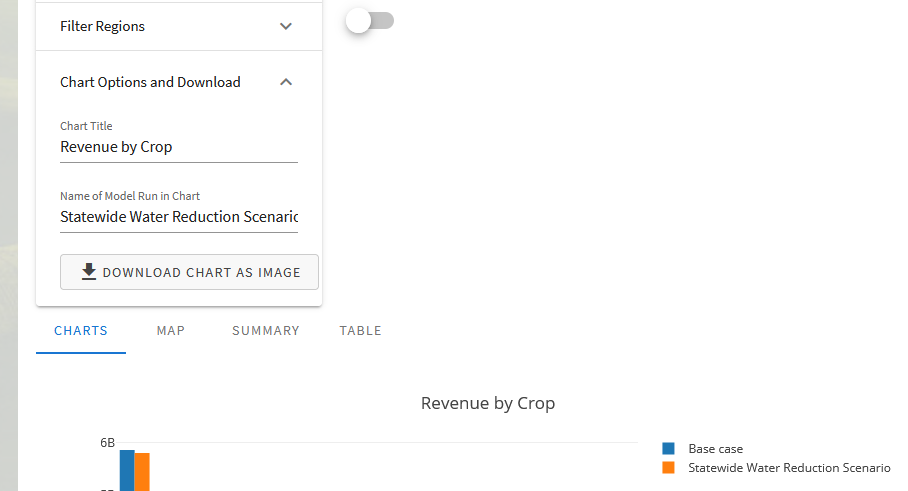
Fig. 21 OpenAg includes a new section to define basic information for the chart, to allow for more useful exports of charts to use in reports. Options include a chart title and renaming the legend entry for the model run in the chart (default is “This model run”). The download button for the chart has been moved into this section to allow for setting chart options and exporting in one spot.#